Debugging JavaScript with Your Browser Console
Facing issues with the plugin’s interactive elements? JavaScript conflicts could be causing the issue. Common symptoms include non-functioning dropdown menus, unresponsive buttons, or infinite loading screen. To help our support team effectively, identifying the JavaScript error is beneficial.
Quick Guide to Troubleshooting JavaScript:
Step 1: Test in a Different Browser JavaScript execution varies across browsers. To confirm if the issue is JavaScript-related or specific to a browser:
- Open your admin in a different browser.
- If the issue persists, it’s likely a JavaScript error. If not, it might be browser-specific.
- Note the browsers where the issue occurs to inform our support team.
Step 2: Activate SCRIPT_DEBUG Enable script debugging to pinpoint the issue:
- Edit your wp-config.php file, inserting
define('SCRIPT_DEBUG', true);before the “Happy blogging” line. - Enable Feed Process Logger: If unsuccessful, enable “Feed process logger” on the settings page, save, and regenerate the feed.
- Recheck your site. If the problem resolves, disable script debugging and inform our support forum, mentioning the debugging step. If issues persist, proceed to the next step.
Step 3: Diagnosing the Problem Access Developer Tools in your browser:
- Chrome/Edge: Use Cmd-Option-J (Mac) or Ctrl-Shift-J (Windows/Linux) or find Developer Tools under the View -> Developer menu.
- Firefox: Use Cmd-Option-K (Mac) or Ctrl-Shift-K (Windows/Linux) or navigate to Web Development -> Web Console.
- Safari: Enable the Develop menu in Safari -> Preferences -> Advanced, then access Show JavaScript Console from the Develop menu.
- Opera: Go to Tools -> Advanced -> Error Console.
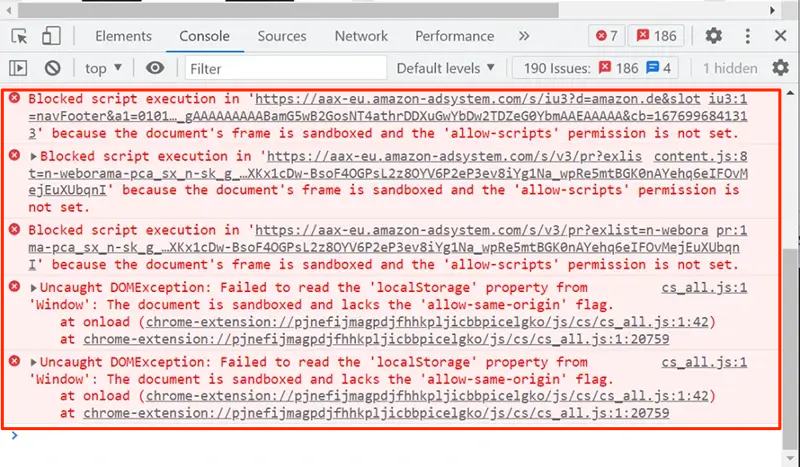
Identify the Error: Errors typically display in the console. Refresh the page if necessary, as some errors only appear on the initial load. Capture the entire error message, including file name, line number, and any stack information for context.
Step 4: Report the Issue Armed with error details, head to our support form and submit the issue your are experiencing.
When submitting a request, please include:
- Affected browsers.
- Whether enabling SCRIPT_DEBUG resolved the issue.
- Detailed error message and location (file and line number).
- Full error context (stack information).
- A link to the page displaying the error.